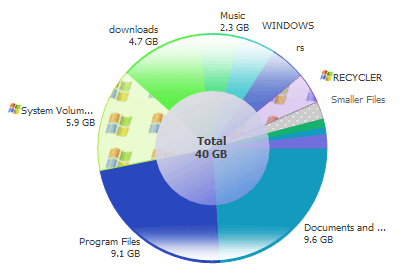
A typical pie chart instantly generated by DiskView showing the structure of a disk.

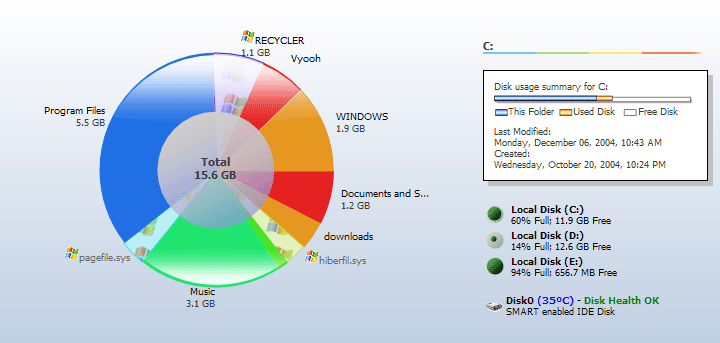
|
|
|
|
|
|
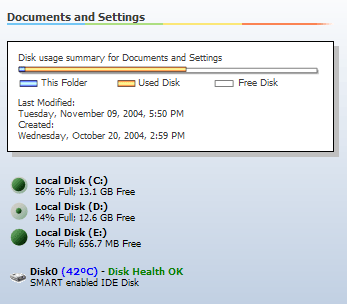 The summary view on the right shows what percent of the total disk-space(white bar) is filled(yellow bar), and what percent of it is being occupied by the current folder(blue bar). It also shows icons for each local disk on the system showing their current disk space usage. |
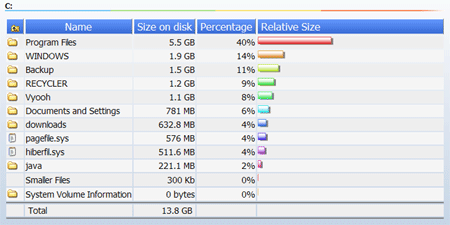 The bar chart visualization mode of DiskView Visualizer shows the 'size on disk', percent of space occupied and relative size of the files and folders. |
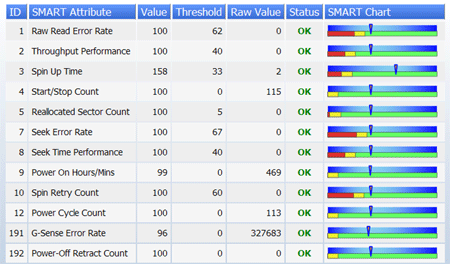 The disk health visualization mode of DiskView Visualizer shows the disk health parameters reported by S.M.A.R.T. As the pointer (value) is in the green zone(more than threshold), disk health is good. If the value is in the red zone for a pre-failure condition, an immediate backup is strongly recommended as disk failure is imminent. |
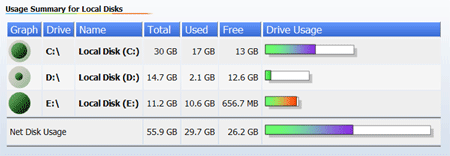 Net Disk Usage summary for all local disks is reported on navigation to "My Computer" |
 DiskView Size and Relative Size columns added to details view of Windows Explorer. DiskView fills in the size of folders while Windows Explorer leaves them out. |
Shell context menu is integrated with the Pie and Bar charts - right click the pies as if they were files/folders. |
File fragmentation is reported visually. If your commonly used files are getting fragmented, it's time for defragmenting and speeding up your computer! |